“If you can’t measure it, you can’t improve it”: Peter Drucker

All too often, in an effort to be ‘data-driven’, teams fall into one or more of the following traps:
- Tracking the wrong things, or not tracking things in enough detail, leading to data that is not providing actionable insight
- Tracking everything possible, without a plan on how to leverage it, knowing that it might be useful at some point. This can lead to code bloat, over-use of network connection in the app and potentially wasted dev cycles implementing or updating redundant tracking
- Failing to effectively structure and process the data that is collected, leading to a mounting heap of unused or surplus analytics data that fails to add value
- Analysis paralysis: spending tons of time slicing and dicing data, but failing to act on it (often exacerbated by unstructured or surplus data)
- Failing to keep analytics up to date with new product updates, leading to data which does not reflect product usage accurately
To mitigate these risks, it’s helpful to take a Lean approach to analytics tracking, as well as the process around working with the data collected. Teams would do well to consider what constitutes Minimum Viable Analytics: the data they need in order to make effective decisions. This definition will, naturally, evolve over time as the product matures and the team grows. Brian Balfour expands on this theme in his essay about the Data Wheel of Death. Balfour stresses the need to think about data as a process, rather than a project.
In the rest of this article, I’ll present some guidelines to help teams figure out the minimum viable level of analytics needed to iterate on product and marketing objectives at different stages of growth.
A Short History Lesson and a Detour into MVP
In the distant past, mobile games and applications were developed in-house by the cellphone manufacturer and ‘flashed’ onto the firmware of the phone directly at the factory, with updates possible only from authorized service centers, and only to the entire phone firmware, rather than individual apps. Apps and games were shipped in a ‘final’ state and would only be modified to fix serious bugs.
These days, mobile apps are updated frequently and developed iteratively: the vogue is to ship (or at least soft-launch) a ‘Minimum Viable Product’ at the earliest feasible moment and refine both product and marketing efforts towards a product-market-fit based on real data on how early cohorts of customers are getting on with the product.
This shift towards iterative, data-informed product development and marketing efforts affords the luxury of correcting mistakes, improving the user experience, making pivots and being responsive to new information. It also creates an increasingly heavy responsibility for those building the product to collect, process and analyze data and use it to inform the direction of future efforts. Furthermore, zeal for building an ‘MVP’ is fertile ground for sloppy coding, technical debt and the development of products or features that are certainly minimum, but not necessarily viable. Even worse, the ‘MVP’ is so over-engineered that it takes a year to ship and hence to test a hypothesis.
In his essay, The Tyranny of the Minimum Viable Product, John H. Pittman gets to the crux of the issue: MVPs are routinely too minimal and often unviable:

All too often, emphasis is on the Minimum rather than the Viable (img src: John H. Pittman)
Over on the Y-Combinator Blog, Yevgeniy Brikman states that MVP is more of a process than a destination or a specific product release:
“An MVP is a process that you repeat over and over again: Identify your riskiest assumption, find the smallest possible experiment to test that assumption, and use the results of the experiment to course correct.” — Yevgeniy (Jim) Brikman
Cautionary Note: Data won’t solve all your problems
It’s important to be realistic about the limitations of analytics. All the data in the world won’t fix a fundamentally bad product. Some ideas simply suck; a lot of them, actually. If your product is built around a flimsy proposition or flawed premise, data will help you understand how much it sucks, but won’t provide a magic wand to fix it. In such cases, tracking some basic behavioral data and reflecting on the dismal engagement and retention may at least help the team realize it’s time to pivot — or repay investors — while they still have funds left to do so.
In more typical cases, cohort data will show you how the product is (hopefully) improving with each release, how new and existing users are interacting with features and where there are drop-offs in key flows such as signup or payment, which can hopefully be improved with careful iteration and testing. Analytics helps the team benchmark the product against competitors or products with similar dynamics. Analytics help validate or disprove hypotheses, improving understanding of users and the broader market, thus contributing to better decision-making in many areas. It’s the foundational competence that empowers a Lean approach to development.
Core use cases and ‘internal customers’ for analytics
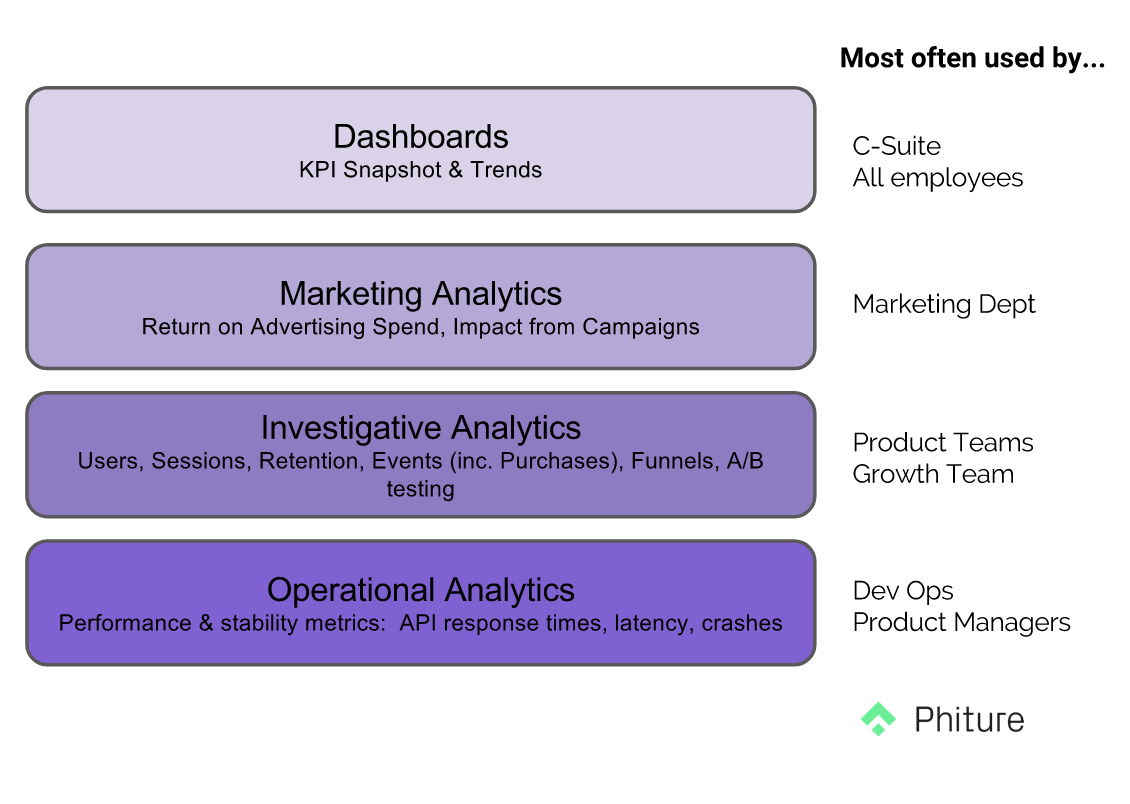
Before deciding what data to collect, it’s worth considering how it will be used. Typically, there are at least 3–4 core use cases, with different internal ‘customers’ within the organization:
Dashboards: The What but not the Why
Dashboards can be a great way to provide instant visibility to the whole company, executives, or a specific team of their most important metrics.
Strategic Dashboards
Strategic or Executive Dashboards provide an at-a-glance snapshot of the Key Performance Indicators (KPIs) that are important to the company. They provide a constantly-available health-check and status of company performance. They won’t tell you why the numbers are a certain way; this is not the purpose of a dashboard.
A minimum-viable ‘company dashboard’ for a company with a mobile product likely includes some or all of the following:
- Active Users (DAU and MAU are commonly used)
- Company-specific engagement KPIs (example: SoundCloud uses ‘Listening Time’ as an internal engagement metric. AirBnB uses ‘Nights Booked’)
- Sales & Revenue Data
- NPS or similar customer satisfaction score (could alternatively show some level of customer service activity such as open support tickets)
CEOs often need stats to show investors; having the key company metrics available at a glance in a dashboard will reduce the number of ad-hoc requests and queries.
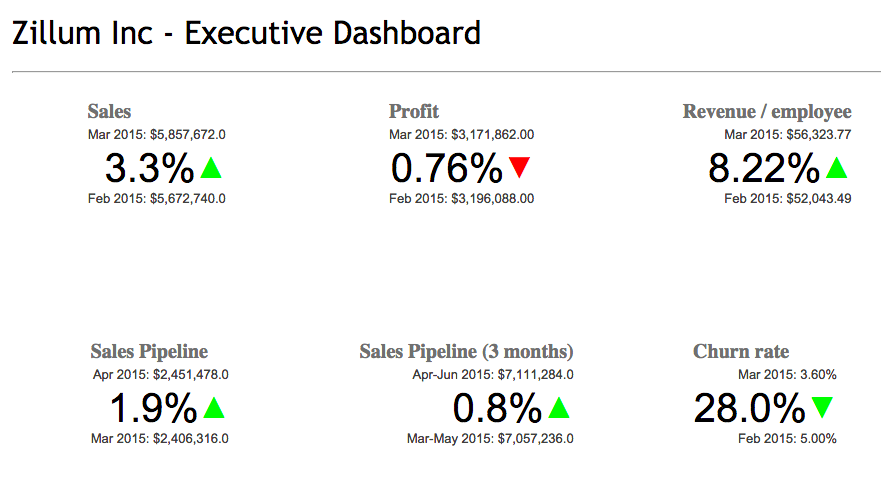
A great example of an uncluttered Executive Dashboard
Having the whole company looking at one dashboard helps to focus efforts and reduces the amount of ambiguity on how the product is performing.
Additional Dashboards
As the company grows, specific teams will likely break out their own dashboards that monitor KPIs for specific features, activities, or platforms.
Operational dashboards can also be useful for monitoring lower-level performance metrics such as server load, errors/crashes, latencies, and so on.
Avoid ‘Dashboard Fever’: Less is More
It is distinctly possible to fall into ‘dashboard fever’, adding ever more screens and stats in an effort to be comprehensive. Try to stick to the key information that the team should be aware of on a daily basis and keep the number of data points and graphs to the minimum essential set.
An abundance of dashboards invariably leads to confusion about where information is located and dilutes focus. Ad-hoc questions are better answered via investigative analytics as opposed to creating a dashboard to cover every conceivable query.
As with company KPIs, dashboards shouldn’t be modified too regularly; much of their value comes from providing a consistent and well-understood view of performance. However, it’s worth doing a health-check from time to time to ensure that any dashboards are still valid, accurate and necessary; avoid dashboard-creep by observing the ‘Minimum Viable’ set of KPIs that provide a clear and concise overview for the company or team.
Marketing Analytics
Marketing Analytics encompasses measure and optimize the impact of advertising efforts to acquire new users, or re-marketing efforts to engage existing or lapsed users via channels such as email/push or 3rd party ad networks.
Ultimately, marketing analytics should reveal the ROI from various channels and activities and provide enough granular visibility to optimize those activities.
At a very basic level, a marketing analytics setup should provide information about:
- mobile app installs generated from various traffic sources and marketing campaigns
- engagement, conversions and/or revenue derived from various marketing activities and campaigns
As with the rest of the analytics stack, the level of complexity that constitutes minimum and viable will evolve as the business grows and marketing activities and budgets increase.
The definition of viability of a marketing analytics setup may differ depending on the industry and app category: apps or games that compete in fiercely competitive categories against corporate behemoths with multi-million dollar advertising budgets have a higher bar than others. Similarly, if a company is not yet spending money to acquire users with performance marketing and instead growing mostly through virality, PR, cross-sell, search or other ‘organic’ channels, it can likely get away with a considerably leaner marketing analytics stack; complexity and capability increase in line with marketing activity and spend.
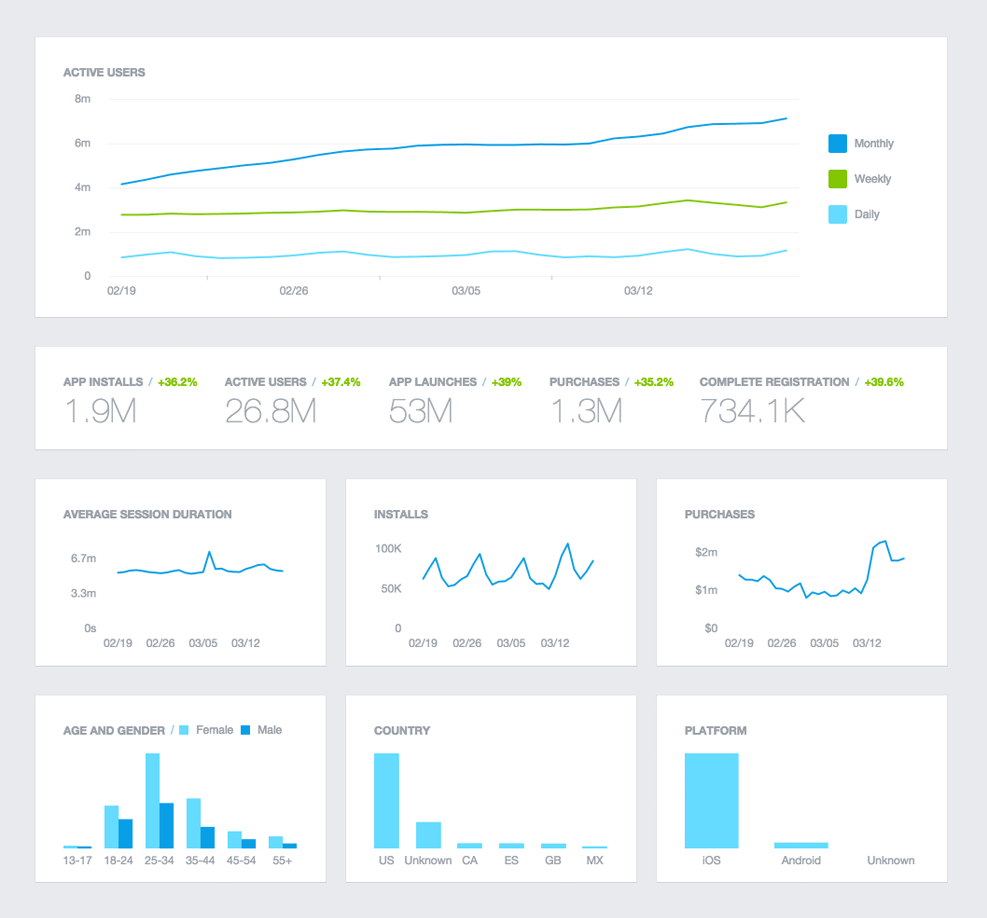
Facebook Analytics Dashboard
At launch, Facebook Analytics, plus the insights derived from Google Play Developer Console and iTunes Connect may provide enough insight into the marketing activities that are delivering the most impact.
As acquisition and retention efforts become more sophisticated, the definition of viable analytics evolves. An attribution partner for measuring the effects of app install campaigns, cross-sell links and viral shares on user acquisition becomes essential, as does a way to properly measure the impact of push notifications and email campaigns. Predictive analytics to estimate retention and LTV of new users quickly and accurately becomes increasingly important as advertising spend increases. The same goes for the capability to automatically recalculate and push segments to Facebook and other networks to generate lookalikes, re-targeting, and suppression lists.
Not all acquisition channels are equally measurable/attributable, which can increase the challenge of evaluating the relative value of marketing efforts across channels. Snapchat, for example, provides limited visibility (though this is being addressed). TV advertising for mobile apps is tough to measure, PR and influencer marketing even more so.
As Eric Seufert and others have pointed out, savvy marketers do not shy away from performance marketing efforts on channels that provide less-than-perfect measurement, since these nascent channels have a great upside for those who can effectively master them. Brian Balfour encourages consideration of less-measurable channels when refining an acquisition channel mix. Ultimately, marketing analytics is about understanding and improving the value (as a function of cost and impact) derived from specific channels and campaigns.
Marketing Analytics is therefore a huge and complex topic in its own right and, for some businesses, an edge in the sophistication of marketing analytics capabilities might mean the difference between market domination and defeat at the hands of competitors.
(For a deeper dive into sophisticated marketing analytics and associated tech, check out Eric Seufert’s excellent post on the Mobile User Acquisition Stack).
Out-of-the-box measurement tools from email and push providers often provide only limited visibility into the true impact of these channels, since they tend to focus on leading conversion metrics such as message open and click rates. To extract the most value from messaging campaigns, growth marketers will also want to ingest campaign data at a user level back into their investigative analytics layer to evaluate the downstream impact on retention, engagement, and LTV. This goes double for advertising channels, where costs increase rapidly with activity.
Investigative Analytics
Dashboards are great for keeping the whole team on the same page at a macro level, but for day-to-day questions about how features are performing, how users are interacting with the product, etc. a level of flexibility is needed that dashboards (even with some fancy filters) do not provide.
Consider some specific scenarios:
- Looking at conversion funnels for specific features or user experiences (e.g. signup, purchase, or use of a feature)
- Slicing and dicing cohort retention tables by different variables e.g. to look at ‘feature retention’ (retention of users who used a certain feature / performed a certain action)
- Creating segments of users with certain characteristics and deriving actionable insights from them
- Figuring out what behavioral or demographic characteristics separates one group of users (such as those that make purchases) from others
- Figuring out what path users take through the app and what features or content are most popular/underused
This kind of investigation can lead to important discoveries about the product, its users, the effectiveness of marketing efforts, or all of the above, leading to actionable insights that inform new segmentation approaches or experiment hypotheses.
Building custom SQL queries or dashboards to answer these kinds of ad-hoc questions often takes time or skills that are in short supply. A team in which everyone is SQL-savvy and is capable of writing their own ad-hoc queries is well worth fostering since it will reduce numerous bottlenecks. However, poorly-written queries can lead to bad data and incorrect conclusions, so this approach is not without risks, particularly as the team grows.
Versatile, visual analytics tools such as those provided by Amplitude, Leanplum, Localytics, Mixpanel, etc. enable (for a price) this kind of analytical capability in a user-friendly interface that everyone in the team can quickly master. In many cases, the same tool can be used to build company dashboards as well as doing more ad-hoc investigative work.
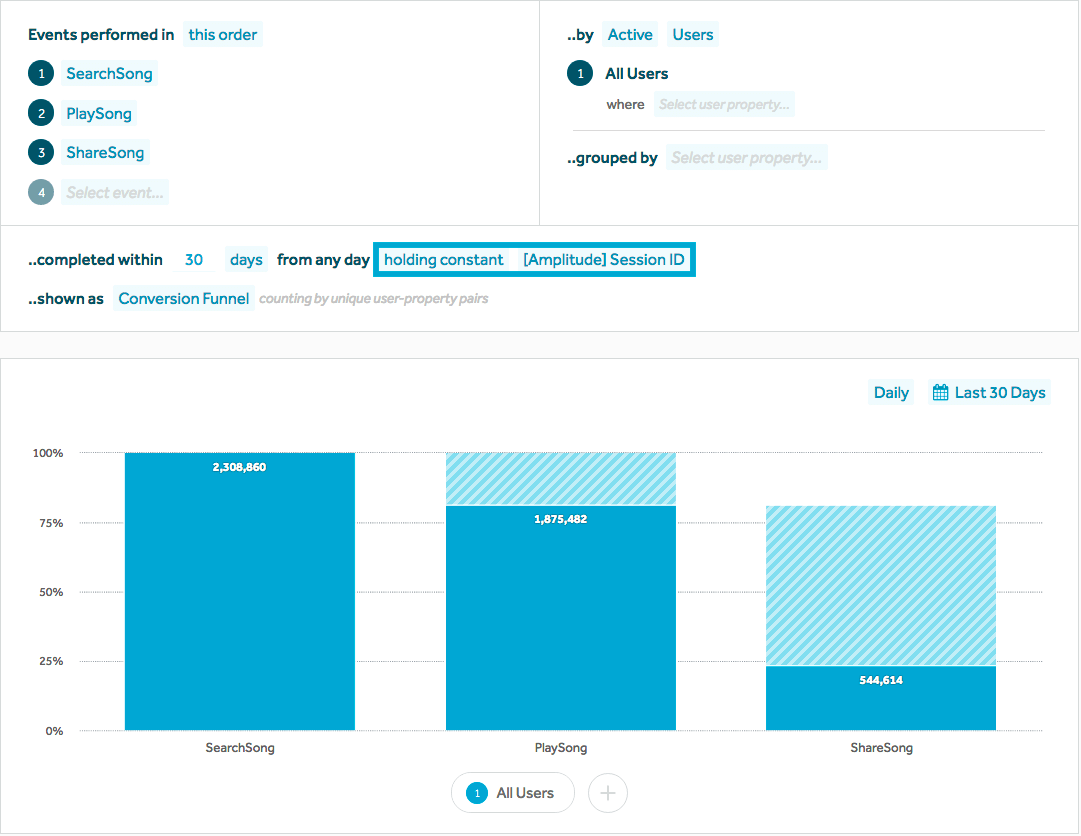
Funnel Analysis: a great investigative tool. Img credit: Amplitude
Many teams track all of their data through one of these off-the-shelf products, though many others choose to own and maintain their own data warehouse for user and event data — maintaining their own ultimate source of truth — while piping a subset of events to commercial analytics and marketing tools to enjoy the benefits of their flexible UI. Maintaining an internal data warehouse reduces dependency on any single third party solution and also provides a route to building out more custom in-house analytics and reporting as the business matures.
In terms of what constitutes a minimum viable setup for investigative analytics, the following capabilities should be present, ideally from day one (i.e. from the day the product has real users):
- User Tracking (identification of unique users, such that their behavior can be tracked)
- Cohort Analysis
- Funnel Analysis
- Behavioral Segmentation
A pre-requisite for the second two is that important events are logged as they happen in the app and there is at least some concept of user tracking, such that events can be attributed to specific users.
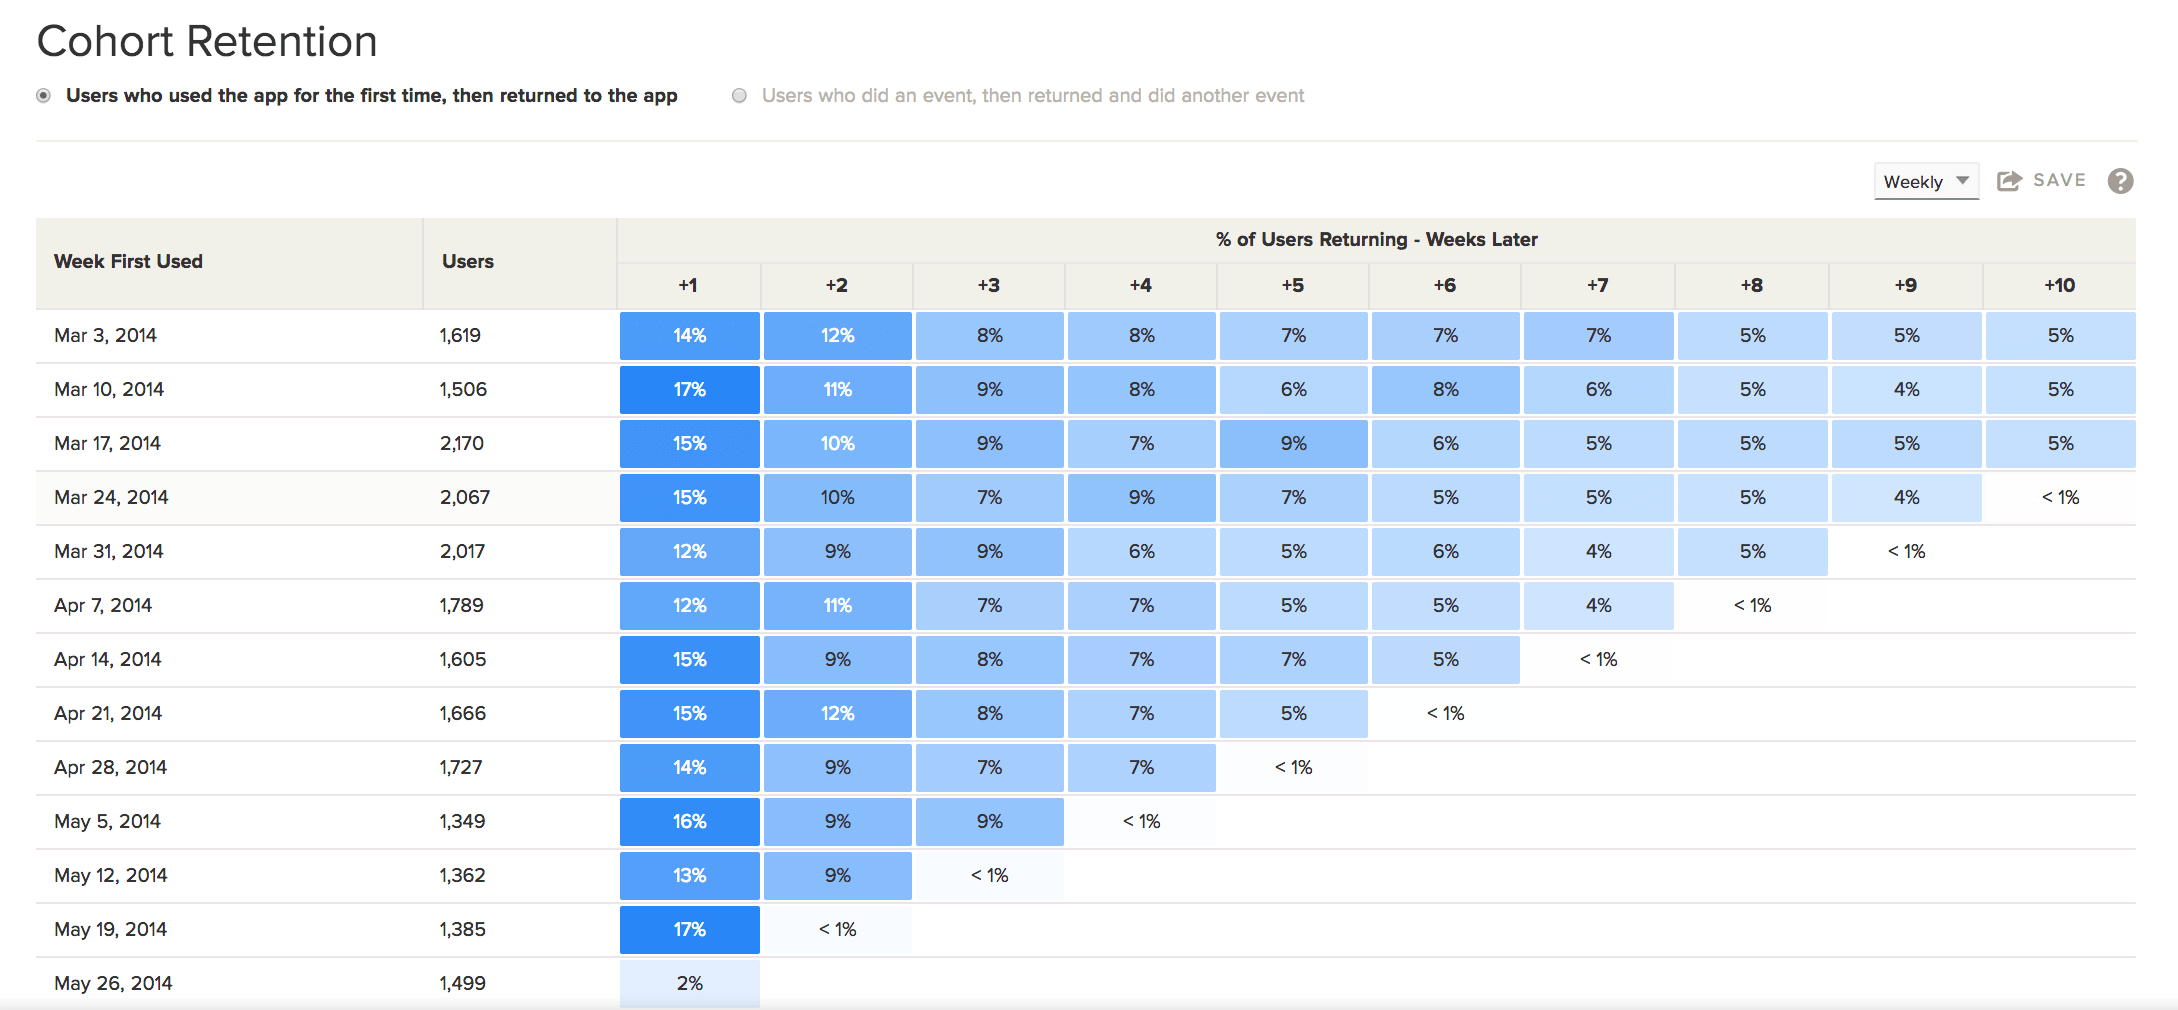
Cohort analysis needs to be part of any Minimum Viable Analytics setup. Img credit: Localytics
There’s really no excuse for not having these capabilities at launch: free tools such as Flurry Analytics provide all of this and more out of the box with a functional dashboard. Other freely-accessible services including Facebook Analytics, Fabric and even iTunes Connect provide some basic cohort and segmentation capabilities, as well as more specialized features in their own respective domains.
Operational / DevOps Analytics
If your product is not functioning, nothing else particularly matters except fixing it. The complexity of modern mobile products leaves ample room for server downtime, outages or API failures from critical 3rd party services, client-side crashes, DDOS attacks and other such drama.
Tracking some basic stuff like server availability, API response times, app crashes, etc. as well as setting up alerts, so that the people responsible for fixing these things get notified immediately when outages occur, may literally save the business, or at least mitigate the fallout considerably.
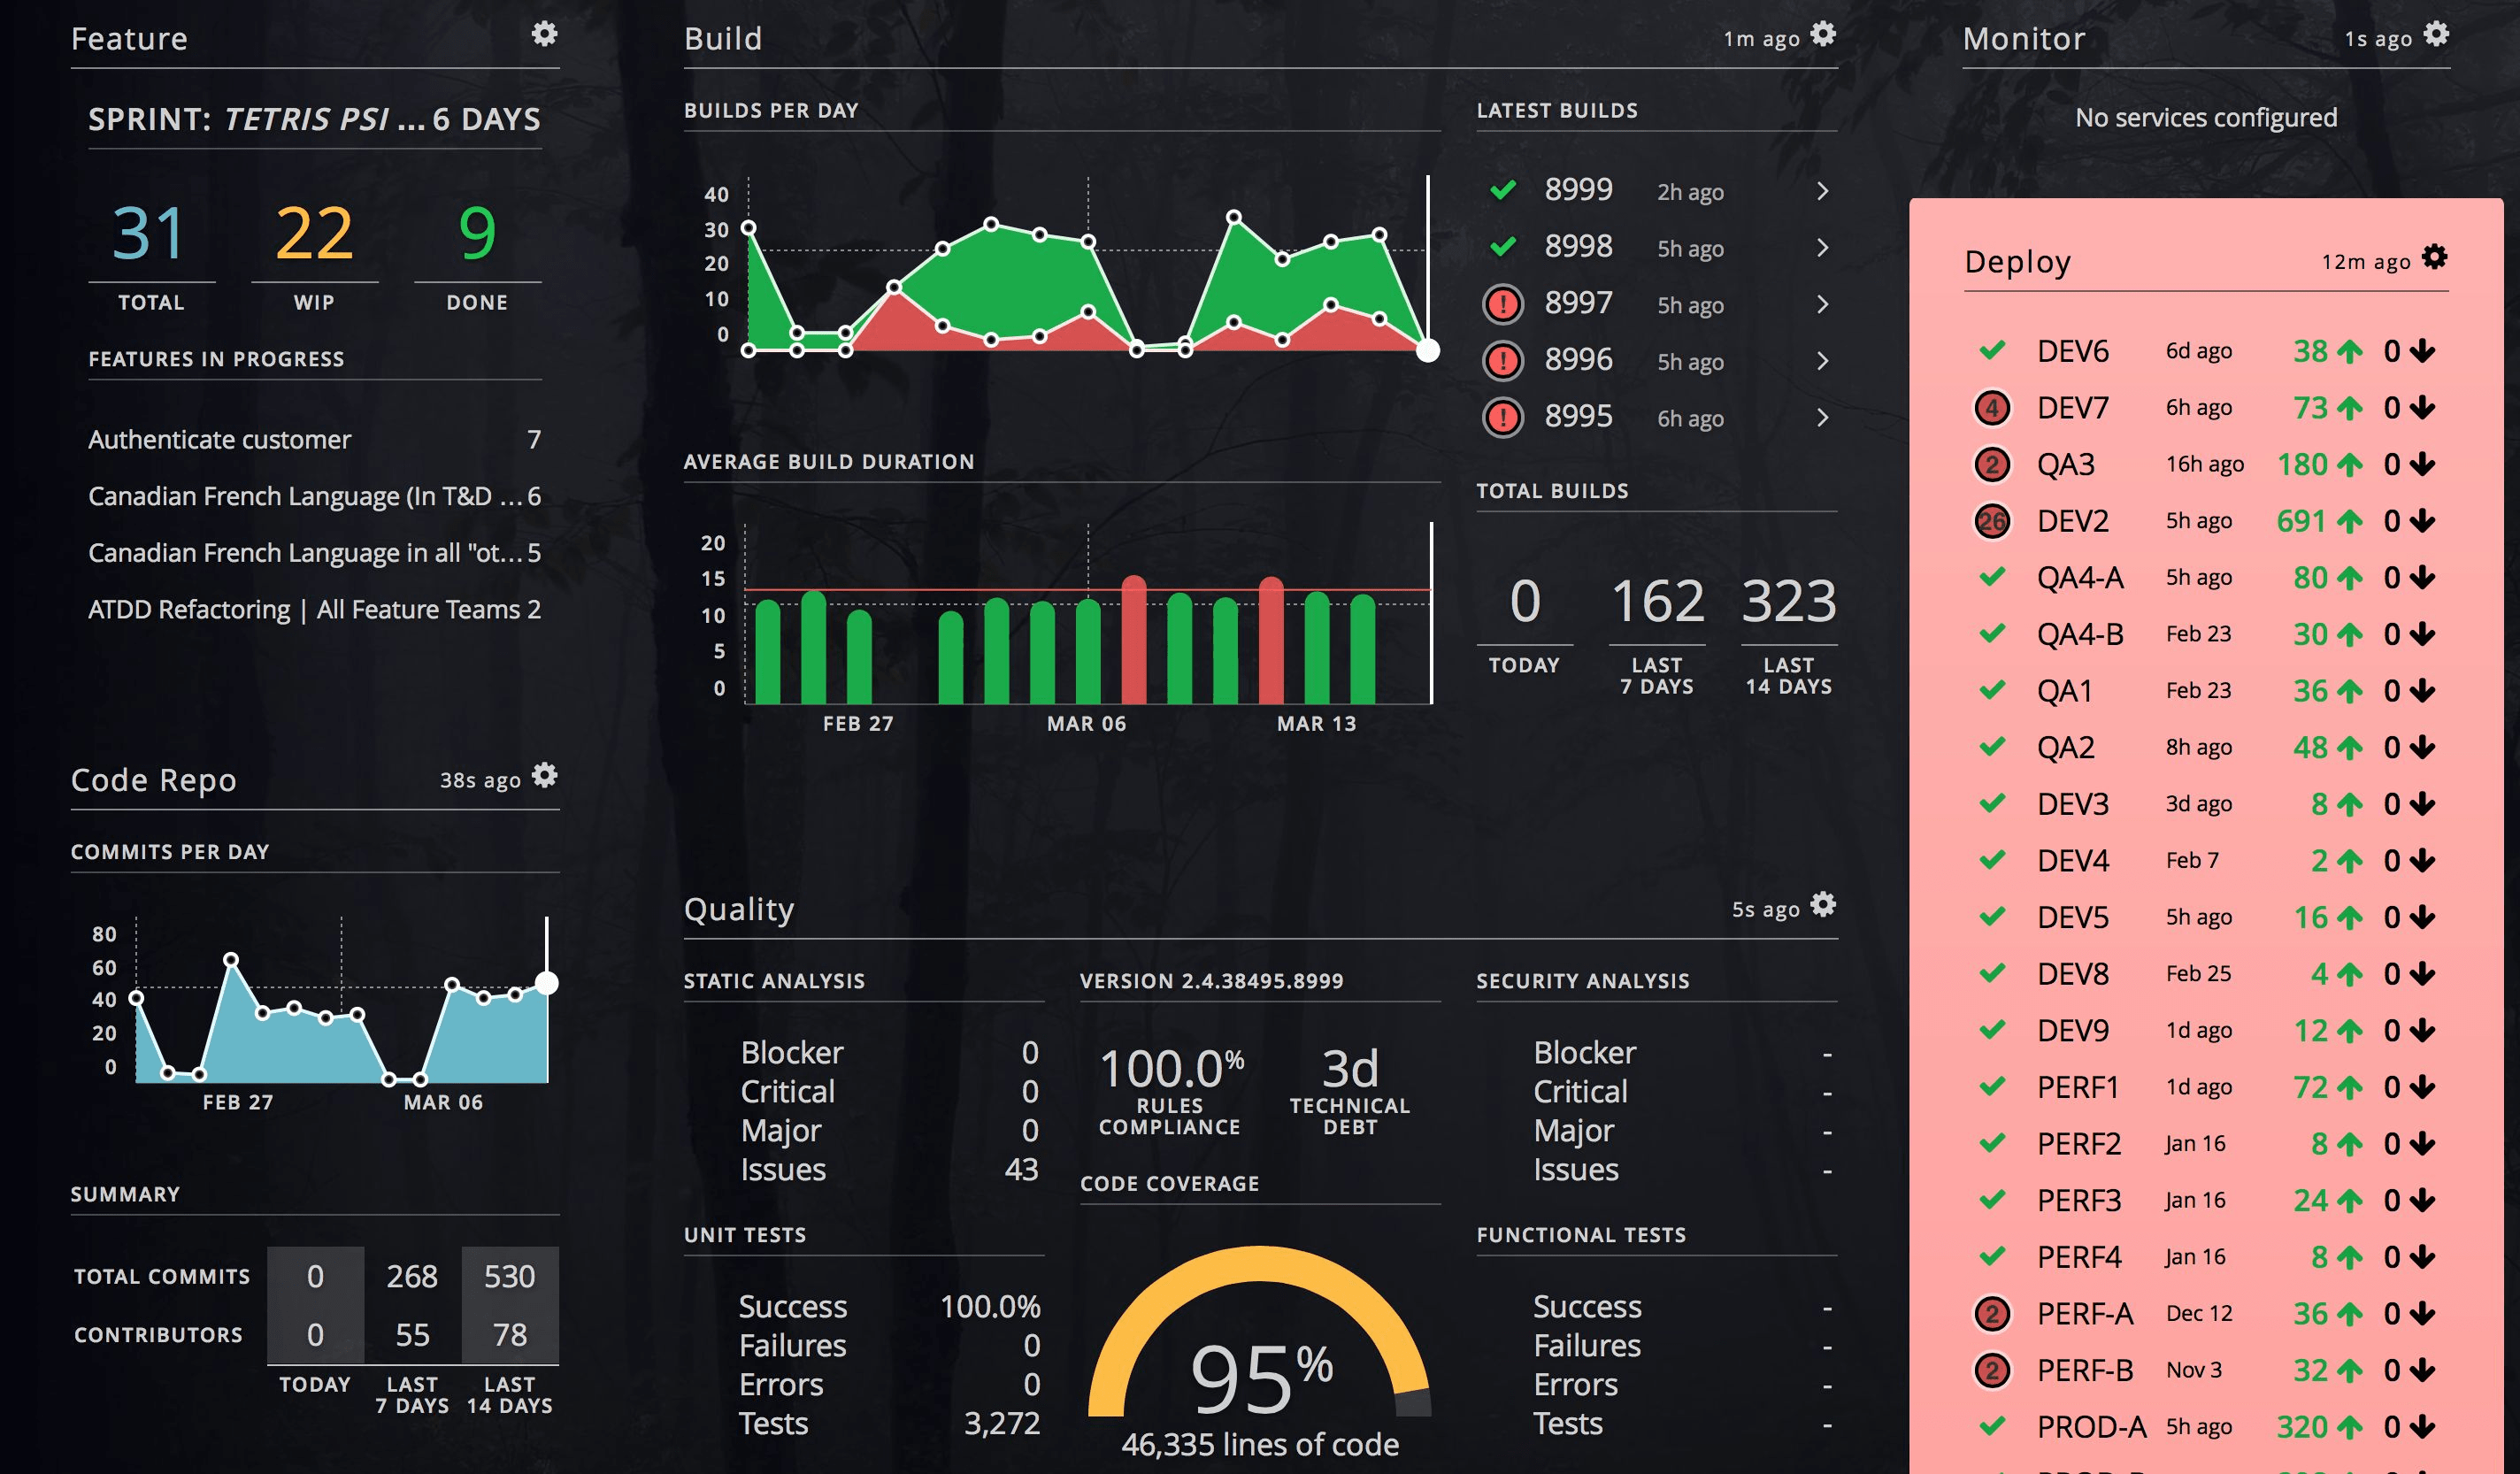
DevOps Dashboards can look a little daunting to non-engineers
Free reporting tools such as Crashlytics provide valuable insight into the number and causes of app crashes and there exist many services for monitoring of API availability, including APImetrics, RunScope, etc. AppSee go one further.
The eternal Build vs Buy debate
At a certain scale, companies tend to in-house some or their entire analytics stack, citing cost savings and customization as core benefits. As with most build vs buy decisions, the decision on such moves boils down to an evaluation of current and future business needs, core competencies, and in-house expertise.
The Minimum Viable Analytics stack for any given product will necessarily change over time, as the level of measurement and reporting that was minimally necessary at launch will not be sufficient to support the needs of a growing organization and increasingly complex product heading towards millions — or hundreds of millions — of users. As such, the build vs buy debate is a healthy one to have at various stages of company growth. In the early days (and, often years), the opportunity cost of building and maintaining custom in-house analytics often outweighs the benefits, but over time — especially with hyper-growth — the balance can shift.
More critical than the underlying technology is the data itself, along with the capacity to manipulate and extract value from it in ways that derive business value. Such capabilities are as much organizational as technological, though the companies that succeed find ways to excel on both fronts.


